Boost the performance of the Salesforce B2C Commerce Site

Are you an online retailer striving to enhance the performance of your storefront experience?
Understanding the slowdowns and optimization techniques can help you improve the speed and responsiveness of your website. This leads to higher rankings in Google search results.
This article will summarize the essential tactics needed to increase the performance and business success of your Salesforce B2C Commerce site.
Website performance: What is it? Why is it so important?

Website performance measures how effectively a site can deliver and convey critical information. It refers to how rapidly a website’s pages load and appear in your web browser.
Google, for instance, incorporates page load speed into its performance evaluation. A page that jumps about, or loads irregularly will receive a lower ranking compared to a page that runs smoothly.
To be high-performing, websites must have a simple technical structure that doesn’t hide or impede users’ ability to access the information they need. Your website’s first impressions are crucial.
The initial performance of a website can significantly impact whether a customer converts. Consequently, if the website fails to meet their expectations, they may quickly leave.
Three factors that, in my opinion, make website speed important include the following:
- User experience
The fundamental goal of improving website performance is to give users a better user experience (UX). A high-performing site can leave a strong lasting impression and make visitors more likely to return.
Most users rate speed as being at the very top of the UX hierarchy of their needs. This isn’t too surprising, because you can’t really do a whole lot until a page is finished loading. You can’t derive value from the page, you can’t admire its aesthetics.
The pyramid graphic below shows how important is speed to users:
- Brand perception
A slow, poorly-performing website will give a negative impression that can damage your company’s reputation. For some visitors, it might conjure up the preconception that you’re unprofessional, and question your ability or even think your site is broken and unsafe.
- SEO
Your website performance can have a sizable impact on your visibility in search results. In 2010, Google incorporated page speed into its ranking algorithm.
Search engines exist to provide the best possible answer to the user’s search query. Although page speed isn’t as crucial as relevance, it can still heavily impact your website’s position in search results. This can negatively affect traffic, conversions, and ultimately, sales.
Where do things go wrong? (Main factors that affect website performance)
There are many factors that make up a successful website, most of which affect website performance. We’ve highlighted the main 4 factors affecting Salesforce B2C Commerce website performance:
- Code
A poorly optimized code that doesn’t add meaningful value, functionality, or substance leads to an inferior user experience. Poorly structured code like invalid HTML markup or JavaScript errors can cause significant dips in performance if left unmanaged.
- Image and file size
Remember that large DOM, graphics, and photos can have a sizable impact on page load times and memory usage. This can also negatively impact Core Web Vitals, affecting your Google ranking.
- HTTP requests
Each resource request decreases load speed, so the fewer requests you have, the better your site will perform.
- Caching
An effective caching policy increases the speed and efficiency of web browsing, reduces the load on servers, and improves the user experience.
Some of the best practices for Web Caching are:
- Set Appropriate Cache-Control Headers
- Use ETag Headers
- Cache Static Content
- Cache Dynamic Content Selectively
Regularly monitor the caching behavior to ensure that the content is being cached correctly and to identify any issues with the caching behavior.
Performance Enhancement Techniques
So, how can you ensure that your successful sales dreams don’t come crashing due to a poorly performing website?
Server-Side Performance Techniques
Prevent web service issues
Calls can have a significant performance impact when the third-party service stops responding or is responding slowly.
While third-party code may be essential for your site functionality or business goals, it is a good idea to ask your service provider how they can ensure your business continuity even if they experience an outage.
Limit Domains
Each domain included on a page costs DNS resolution time. Many pages incorporate Scene7, Akamai, Salesforce B2C Commerce, or Google (for Analytics). Each domain requires a DNS lookup, which can take from 20 to 120 milliseconds.
The standard recommendation for browsers is no more than two downloads per domain. Sometimes, it makes sense to split data across domains to use concurrent downloads. However, each domain requires a DNS lookup that takes more time.
B2C Commerce offers hosting of static content via its embedded CDN and enables that by default.
Purging Old Data
You will experience site slowness as the data volume increases. So, plan for data retention and cleanup. Excess old data (promotions, coupons, products, redirect URLs, static mapping URLs, etc.) can slow down site performance.
Page Caching.
You can improve the performance and page rendering of your website using caching. Caching controls how often a page containing a data connection requests data from Salesforce.
Logs Cleanup
The system captures log files daily, stores them for 30 days, and then automatically deletes them. The only exception is that it automatically deletes security log files after 90 days.
Allowing files to grow indefinitely can cause performance, and storage issues and will affect sales.
To ensure optimal performance and stability, delete unnecessary log files or archive them in an external system/server.
Client-Side Performance Techniques
Client-side performance techniques are methods and practices that developers implement on the client side (i.e., on the user’s device) to improve the performance of a website or web application and to improve the overall user experience by making pages load faster and becoming more responsive.
Use Progressive Rendering
By controlling the order in which components of a page load, you can give the impression of a faster loading page. Instant feedback from a partially rendered page or a progress bar makes the page feel faster to the customer.
First Page Optimizations
You can use a web analytics tool (such as Google Analytics) to analyze your traffic and find the top-visited first pages for your site. You could expect that your home page is the most visited first page, but instead, discover that a landing page from another site or from customer emails is the most common entry point for customers.
Optimize HTTP trips
For the best performance, ensure your hosting provider can deliver content over HTTP2. HTTP2 is the modern equivalent of HTTP1 and is much faster and more reliable. It also has built-in multiplexing, so it can load more requests in parallel with each other. This helps to overcome lag issues that can crop up.
The ideal design for HTTP2 for best performance is to have a core CSS/JS file that contains common styles used across all pages and specific CSS/JS in a separate file for each page.
Optimize your resource delivery CDN
Content delivery networks (CDNs) consist of geographically distributed groups of servers that work together to provide fast delivery of internet content. CDNs reduce server costs and are well-suited for handling traffic spikes.
CDN servers are located closer to users than origin servers and therefore have a shorter round-trip time (RTT) latency; networking optimizations allow CDNs to deliver content more quickly than if the content was loaded “directly” from the origin server; lastly, CDN caches eliminate the need for a request to travel to the origin server.
A CDN offers a few specific benefits for companies, including
- Faster website load times.
- Lower bandwidth costs.
- Redundancy and scalability during high traffic times.
- Improved security.
Minify and compress network payloads
Minification is the process of removing whitespace and any code that is not necessary to create a smaller but perfectly valid code file. Terser is a popular JavaScript compression tool and Webpack v4 includes a plugin for this library by default to create minified build files.
Compression is the process of modifying data using a compression algorithm.
The most widely used compression format for server and client interactions is Gzip.
Brotli is a newer compression algorithm that can provide even better compression results than Gzip.
Incorporating both of these techniques reduces payload sizes and in turn, improves page load times.
Lazy Loading
Developers use this technique to reduce or delay expensive calculations or data loading. In this approach, a page loads its essential features first and delays the rest, either briefly or until the user performs an action that requires the information.
This technique gives users faster access to essential features, improving the apparent responsiveness of a large page, even though the entire page takes the same total time to load.
Multiple resources can apply lazy loading through multiple strategies:
- Code splitting: JavaScript, CSS, and HTML can be split into smaller chunks. This enables sending the minimal code required to provide value upfront, improving page-load times. The lazy loading approach will load the rest on demand.
- Script type module: The browser treats any script tag with type=”module” as a JavaScript module and defers it by default.
- Make sure to keep CSS thin and deliver it as quickly as possible. It is advisable to use media types and queries to unblock rendering.
- The loading attribute on an <img> element (or <iframe>) is an HTML attribute that can be used to specify how a browser should handle the loading of an image or iframe element.
Keep in mind that the loading attribute is relatively new, and not all browsers support it yet. You should check the compatibility and use it with fallbacks.
Image optimization
is a process of reducing an image without compromising its quality, using either a plugin or script, which in turn speeds up the load time of the page.
Image optimization isn’t particularly complicated. Just a few changes to your current image process could help your site gain more traffic and leads, resulting in more sales.
Several techniques can be used to optimize images and reduce their file size without compromising their quality. Some of the best techniques for image optimization include
- Compression: Using lossless or lossy compression algorithms to reduce the size of an image without affecting its visual quality.
- Resizing: Adjusting the dimensions of an image to better fit the space
- Cropping: Removing unnecessary parts of an image, such as empty space or irrelevant details
- File format: Choosing the appropriate file format for an image. JPEG is best for photographs.
- Image sprites: Combining multiple images into a single image file, reduces the number of HTTP requests made by the browser, which can speed up page load times.
- Lazy loading: Loading images only when they are needed, this can save a lot of bandwidth and improve performance.
- Progressive JPEG: Progressive JPEGs are JPEGs that are loaded in low-resolution first and then as the image loads, its resolution increases.
It’s important to note that the best technique is not a one-size-fits-all solution, and the best approach may vary depending on the specific requirements of your project.

Other General Performance Techniques
Keep track of extra code additions
If you add extra code like tracking pixels or analytic tools, you need to regularly review their usage. We recommend setting periodic reminders to check if they’re still providing useful insights and removing them if they’re no longer required.
Coding Standards for Performance and Stability
Ensure that your customizations follow coding best practices. Identify permissible designs that ensure the scalability and robustness of your customizations.
Performance Metrics
Performance metrics are measurements that can be used to evaluate the performance of a website or web application. These metrics can help to identify areas of improvement and to measure the effectiveness of performance optimization techniques, the following is a list of common performance metrics:
- Load time: This is the amount of time it takes for a page to fully load and become interactive.
- Time to first byte (TTFB): This is the time it takes for the browser to receive the first byte of data from the server.
- First Contentful Paint (FCP): This is the time it takes for the browser to render the first visible element on the page.
- Speed Index: This is a measurement of the average time at which visible parts of the page are displayed.
- Time to Interactive (TTI): This is the time it takes for a page to become fully interactive and responsive to user input.
- Bounce rate: This is the percentage of visitors who leave a website after only viewing one page.
- Page weight: This is the total size of all resources (such as images and scripts) that need to be loaded to display a page.
- Resource requests: The number of resource requests made by the browser when loading a page.
- Server response time: The time it takes for the server to respond to a request.
It’s important to note that these metrics should be considered in relation to the type of website or application, and the user’s expectations, for example, a low load time may be more important for an e-commerce website than for a blog site.
Web-Vitals Metric
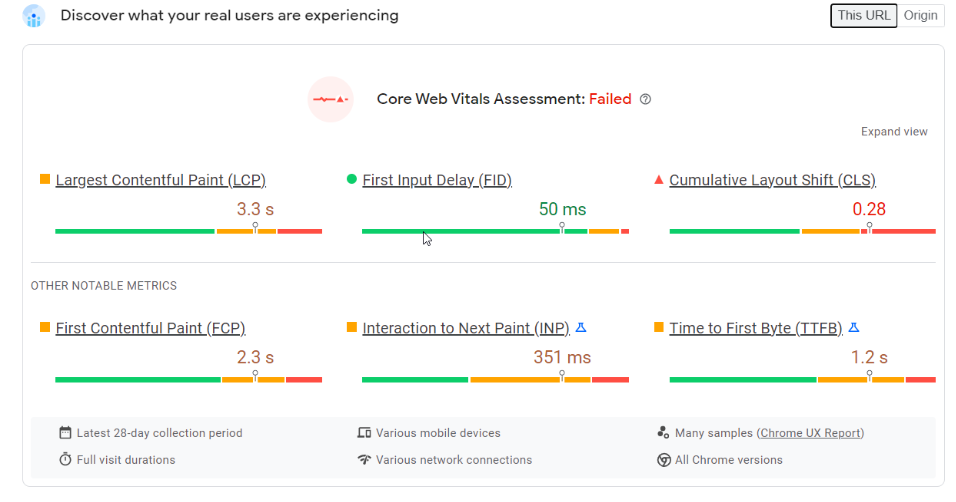
Web Vitals are a set of performance metrics that are designed to provide a holistic view of user experience on the web. These metrics focus on the critical aspects of loading, interactivity, and visual stability of a website.
The metrics that makeup Core Web Vitals will evolve over time. The current set for 2020 focuses on three aspects of the user experience—loading, interactivity, and visual stability—and includes the following metrics (and their respective thresholds):
- Largest Contentful Paint (LCP): measures loading performance (the time it takes for the largest element on the page (such as an image or video) to load and become visible).
- First Input Delay (FID): measures interactivity (the time from when a user first interacts with a page (such as clicking a link or button) to the time when the browser is able to respond to that interaction).
- Cumulative Layout Shift (CLS): measures visual stability. (the amount of layout shift that occurs on a page, which can cause visual instability and a poor user experience).
For each of the above metrics, to ensure you’re hitting the recommended target for most of your users, a good threshold to measure is the 75th percentile of page loads, segmented across mobile and desktop devices.
Tools for Improving Site Performance
To ensure peak site performance, limited downtime, returning shoppers, and a delighted merchant, your technical architect need tools and approaches to analyze and continuously monitor the site performance.
These tools will be used to help brands better understand the relative performance of their sites:
Cross-machine or Browser Testing Tools


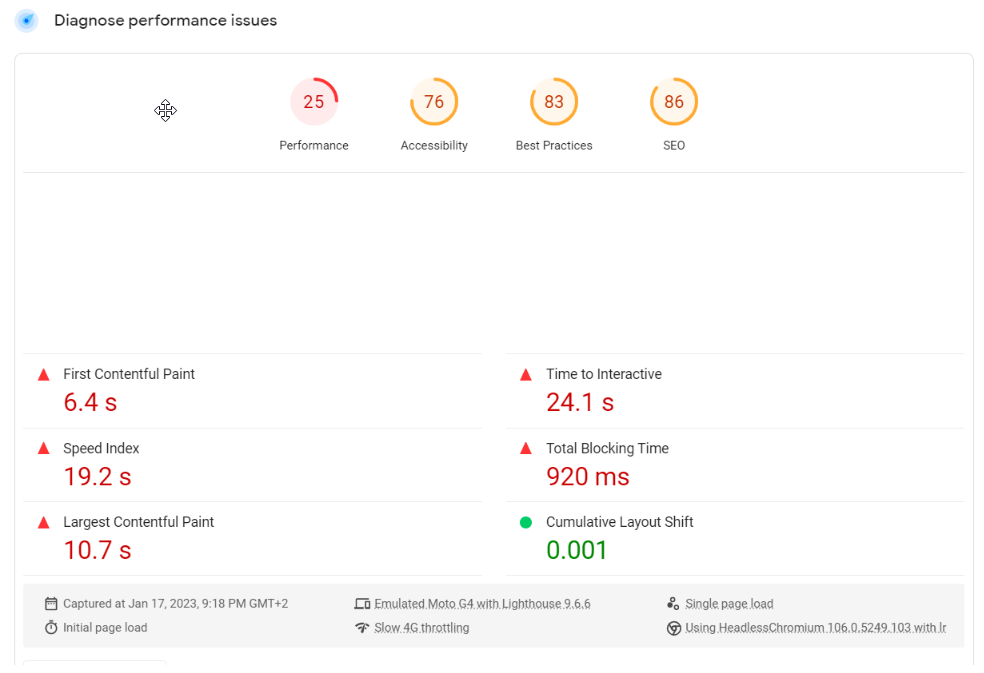
- Google Lighthouse: This is a free, open-source tool that can be used to audit the performance, accessibility, and SEO of a website. It can be run from the Chrome browser or as a command-line tool, and it generates a report with detailed recommendations for improving performance.
You can get a Lighthouse score for your site here: https://web.dev/measure/ - WebPageTest: This is a free tool that allows you to test the performance of a website from different locations and on different devices. It generates a detailed report with performance metrics and a video of the page load.
- GTmetrix: This is a free tool that analyzes the performance of a website and generates a report with detailed recommendations for optimization.
- Pingdom: This tool allows you to test the performance of a website from different locations and it generates a report with performance metrics, a waterfall chart, and a video of the page load.
- Google Analytics: This tool provides you with useful performance metrics such as bounce rate, page load time, and the number of resources requested.
- SpeedCurve: This tool allows you to track the performance of your website over time and compare it with the performance of your competitors, it also provides you with detailed recommendations and an actionable plan to improve your website’s performance.
Server-Side Performance Testing Tools
Use the code profiler, and pipeline profiler dashboards to identify performance problems.
- Code profiler
Run-time performance can be better measured by using the Code Profiler.
A background job exports the Code Profiler data hourly to the file system into CSV files, which you can download. After the export, the data in the server is reset. The Code Profiler screen shows data only since the last reset.
- Pipeline Profiler
To optimize the performance of scripts and pipelines during development and testing, use the Pipeline Profiler. Each node and script in a pipeline have their pipeline run times collected and aggregated by the Pipeline Profiler.
It’s important to note that the best tool for you may vary depending on the specific requirements of your project. And it’s always a good idea to test multiple tools to find the best fit for your needs.
Final Words
Web performance is important for accessibility and also for other website metrics that serve the goals of an organization or business. Good or bad website performance correlates powerfully to user experience, as well as the overall effectiveness of most sites. This is why you should care about web performance.
If you’d like a personalized performance assessment or need assistance to unlock the full potential of your Salesforce platform, contact ITG Software; a proven Salesforce Partner driving exceptional results for over 22 years.


